
Mini-Multifamily Report 2026
Top Markets for the Mini-Multifamily Asset Class


Introduction
Groma has historically focused on the small multifamily asset class–that is, non-amenitized multifamily rental properties with 2-20 units. The difficulties of managing this class of properties, as opposed to traditional/large multifamily, have kept it largely out of bounds for institutional investors, creating opportunity for operators who can solve the relevant logistical problems and reap the returns of this untapped market.
As we’ve grown, it’s become increasingly clear that many of the same dynamics apply to multifamily properties with 21-49 units, meaning that operators and sponsors looking for exposure to small multifamily properties can look at the broader set of 2-49-unit properties for a larger, but structurally similar, opportunity. We semi-jokingly call this combination of small and mid-market assets “smidmarket”, or, as our PR team would prefer, “mini-multi”. Regardless of name, we believe this asset class will play an increasingly important role for institutional allocators seeking to avoid the challenges of both traditional multifamily assets (low cap rates) and single-family rentals (regulatory risk).
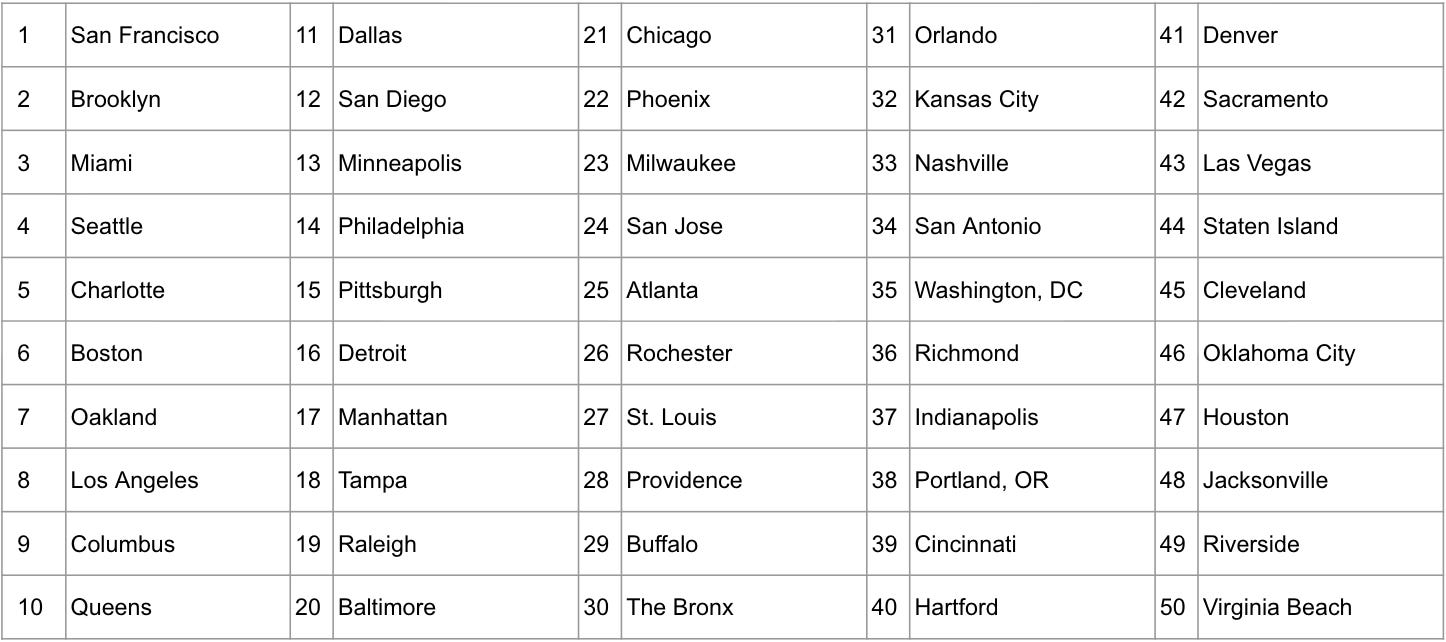
This growth will drive demand for better data and research on many aspects of this market segment; to that end, this report seeks to explore the question of which geographical markets are best suited to mini-multi aggregation investment. To do so, it evaluates the factors that we believe are most relevant to the mini-multifamily asset class, identifies metrics to quantify these factors, and applies them to major US markets to create metric-specific and overall rankings.
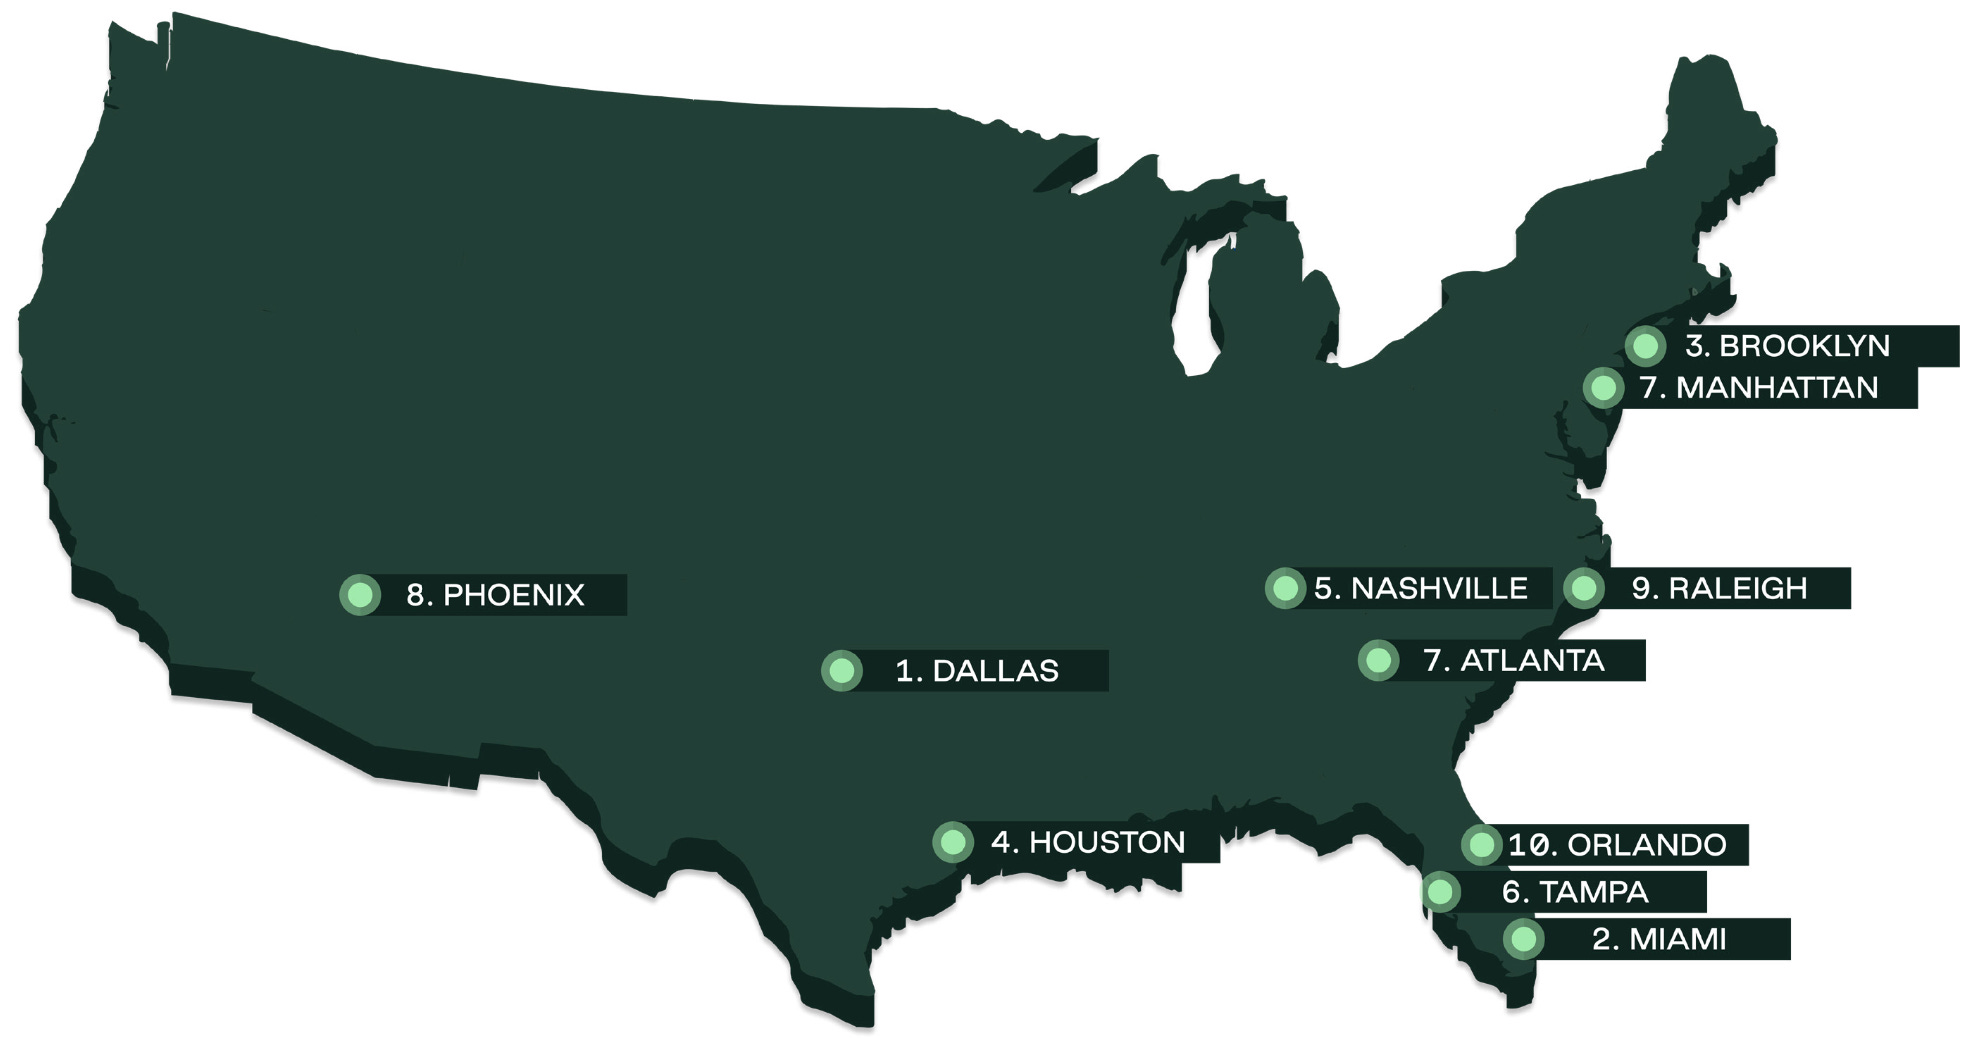
Overall Ranking
Overall market rankings are based on a weighted index of all individual metrics.
These metrics are:
Small and Midmarket Multifamily Stock
Renting Discount
Governance Risk
Population Density
Growth Constraints
Climate Risk
Economic Fundamentals
Institutional Interest
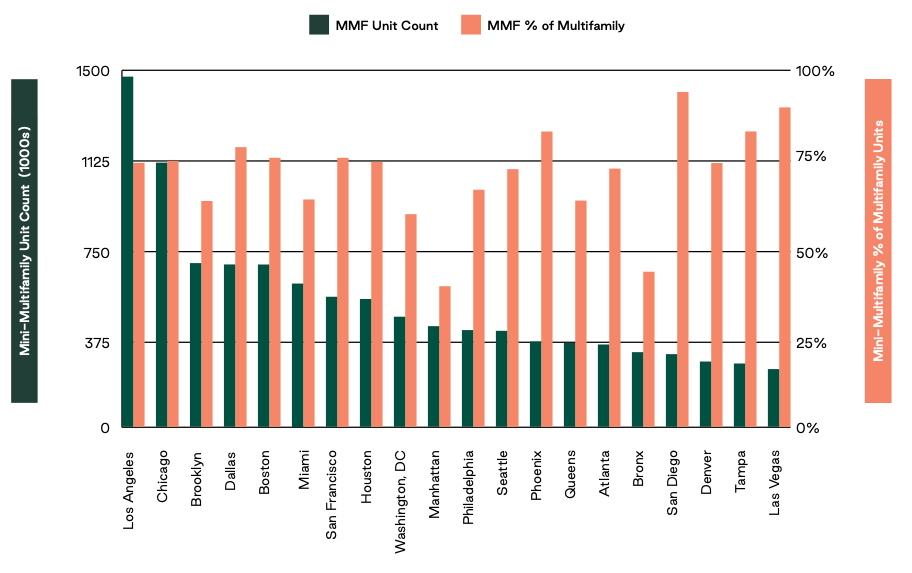
Mini-Multi Stock
Weighting: 6
We ranked markets based on both their aggregate supply of small and mid-market multifamily units and the proportion of their multifamily housing stock in midmarket properties. Both of these factors contribute significantly to the efficient acquisition and management of properties in this class.
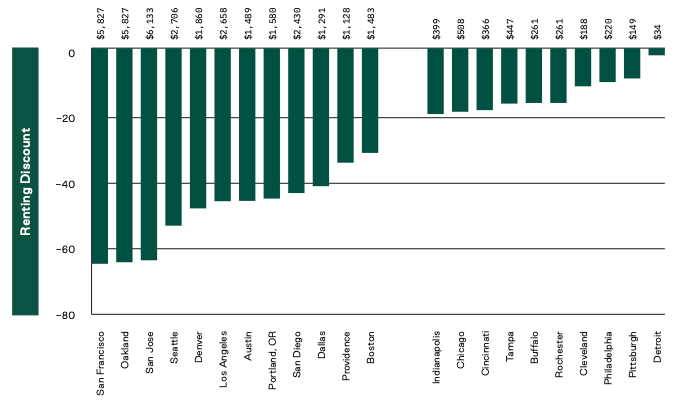
Renting Discount
Weighting: 2
In most metro areas, renting a home is cheaper than buying, but the degree to which this is the case varies between metros. In some metros, e.g. Detroit, renting and buying are almost at parity, whereas in others, e.g. San Francisco, renting is thess than half the price of buying. Markets where this renting discount is greater are ranked higher for mini-multi investment, as the relative unaffordability of homeownership makes rental demand less price-sensitive. The renting discount is shown here both as a percentage of the buy price and as a raw value.
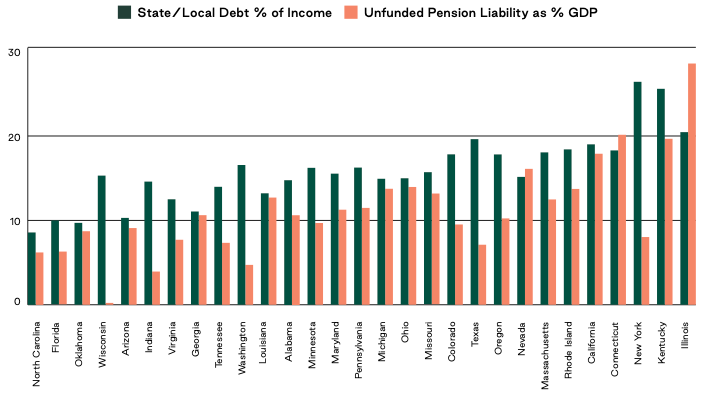
Governance Risk
Weighting: 4
States and cities vary widely in terms of their fiscal discipline and expected future obligations that threaten to increase property tax liabilities in ways that are broadly not factored into current valuations.
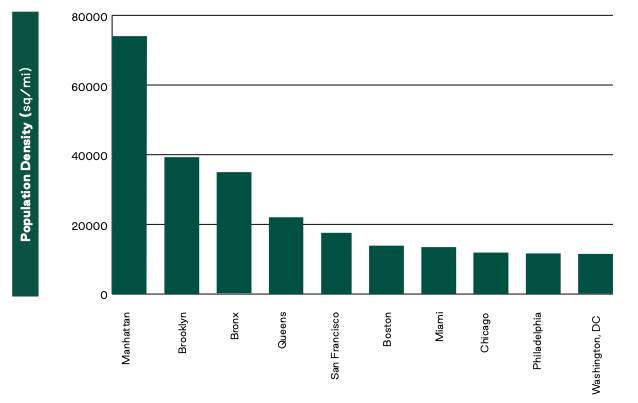
Population Density
Weighting: 2
Small and mid-market multifamily properties typically have fewer amenities than large multifamily properties. This increases the importance of neighborhood characteristics like walkability.
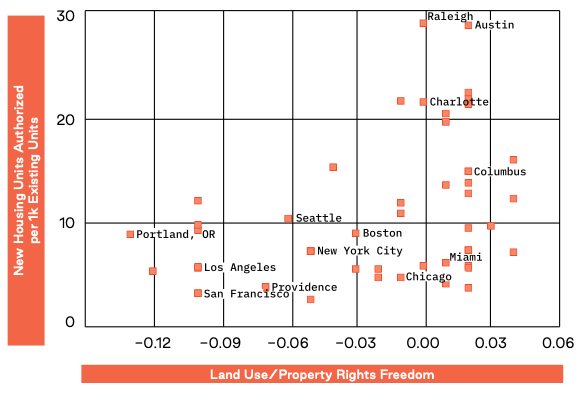
Growth Constraints
Weighting: 4
Many real estate rankings consider growth-friendly policies a plus, but the buy, optimize, operate, and exit nature of the small and mid-market multifamily aggregation strategy means that these properties tend to benefit from regulatory constraints on new construction. We incorporate both per capita residential construction rates and a survey of land use regulations.
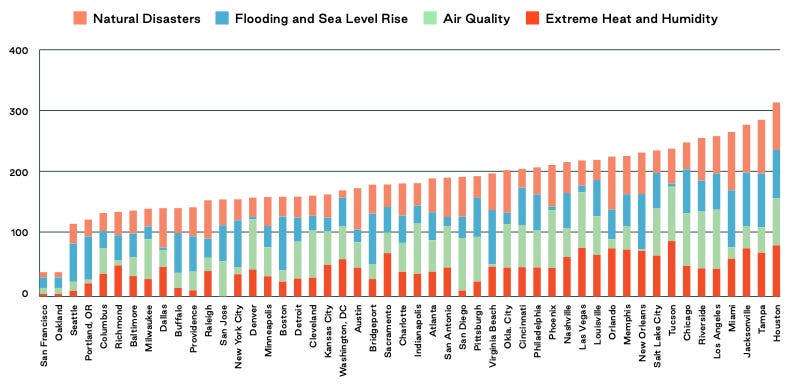
Climate Risk
Weighting: 2
Our climate risk ranking combines data on natural disasters, flooding/rising sea levels, air quality, and extreme heat/humidity. In addition to worsening resident quality of life and thereby decreasing demand, these factors have a major impact on insurance rates, a core driver of operating costs–especially for smaller buildings without the latest mitigation technology.
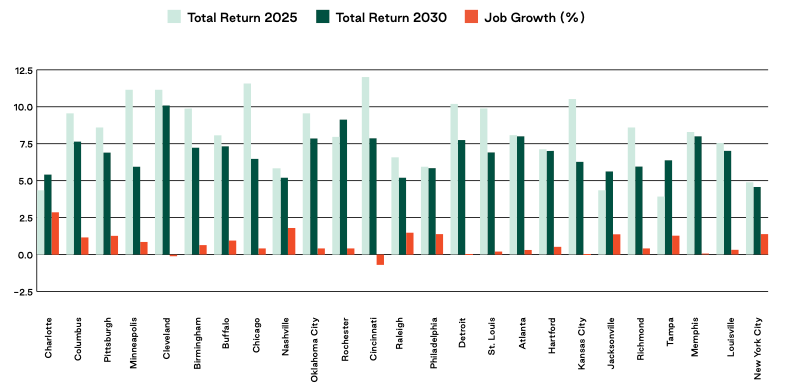
Economic Fundamentals
Weighting: 6
This metric incorporates current and future return expectations for multifamily properties as well as metro area job growth. These metrics apply to all multifamily assets.
Institutional Interest
Weighting: 2
Portfolio exits are a major driver of overall financial performance. This means that sponsors need to be confident that they will be able to find a large buyer at the end of their hold period, which provides an advantage to larger, better-known markets.
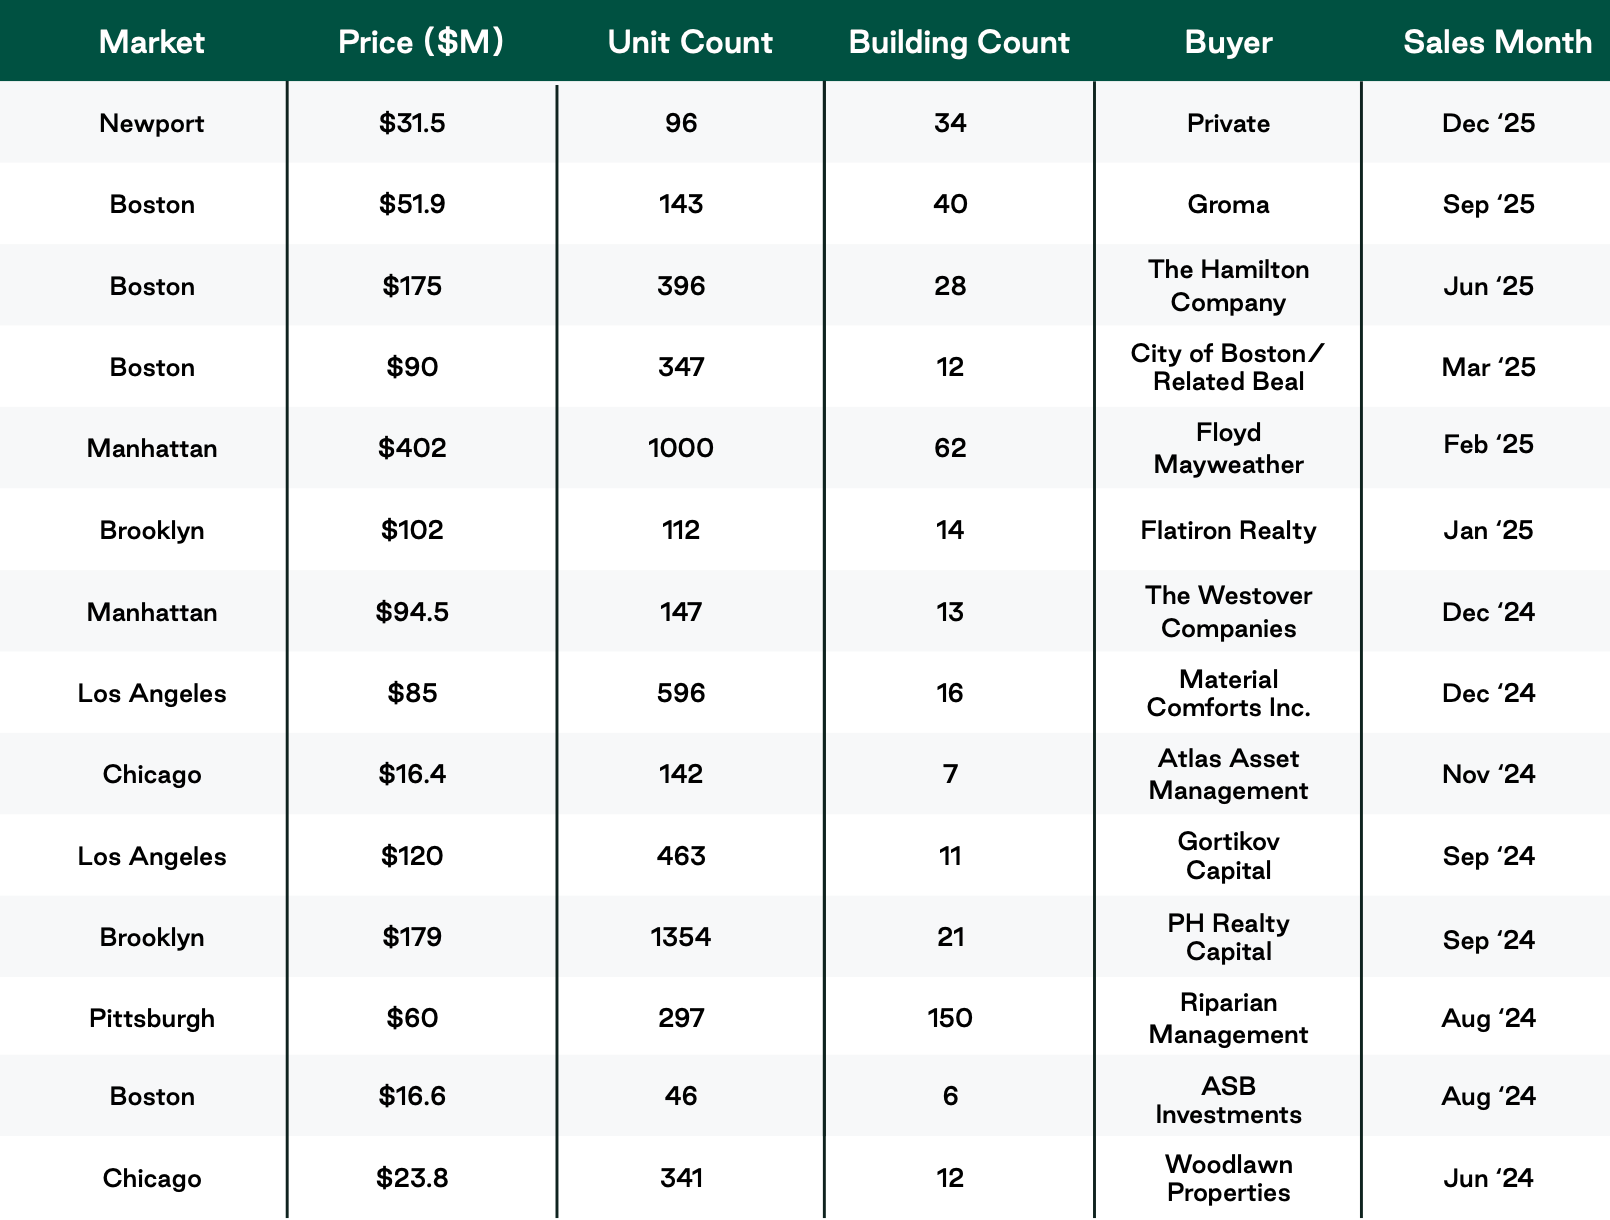
Notable Portfolio Sales
Institutional interest in mini-multifamily properties is growing, and portfolio sales of this asset class to institutional buyers have accelerated over the past few years. Given the importance of the exit transaction to investment performance, these portfolio sales should be seen as a secondary indicator of institutional interest. This is not currently factored into our rankings given that this is a sampling, not a complete listing, of all portfolio sales data for this asset class.
Outlook
With interest rates already having fallen 170bps from their 2024 peak and up to 50bps expected over the course of 2026, the nominal price anchoring of many “mom and pop” sellers of small residential assets is becoming less of an obstacle to acquisition by IRR-oriented professional buyers. Consequently, we expect transaction volume in this sector and in single-family to increase over the coming quarters. Notably, though, institutional single-family investors have been spooked by recent executive and legislative policy proposals to prohibit or punitively tax further single-family acquisitions by large investors. Many of these allocators are now looking for assets that present a similar return opportunity without the policy risk; mini-multi may fit the bill.