Summary
Boston Mayor Michelle Wu has proposed major tax hikes on commercial properties coupled with a large budget increase in the face of anticipated tax revenue shortfalls. This is a misguided approach; this article seeks to explain its flaws and outline alternatives to maintain Boston's position as the economic engine of New England.
Introduction
This essay began as a narrow response to Boston Mayor Michelle Wu’s proposal to hike commercial property taxes in the city, but has since evolved into a broader discussion of Boston’s fiscal situation, the political and economic dynamics behind it, and potential paths forward. It owes a significant debt to previous reporting done by the Boston Municipal Resource Bureau, the Boston Policy Institute, and the Tufts Center for State Policy Analysis, many of whose graphs feature in it.
It should also be noted up front that Groma is an owner and operator of residential properties in Boston. This is the exact class of properties that Mayor Wu’s proposal seeks to protect from increased taxes. Our opposition to this proposal stems from our long-term commitment to Boston’s success, which relies on its status as a global center of the knowledge economy–a status that would be threatened by this proposal.
I’ll start by providing some background on the current debate over Wu’s tax proposal: what is the state of Boston’s tax base, why does she want to raise taxes generally and these taxes in particular, and what is the relationship between city and state government regarding this kind of policy change. I’ll then do a deeper dive into Boston’s fiscal situation, looking at the current state of taxes and spending and evaluating the city’s situation relative to other current polities and a similar episode from Boston’s history. I’ll then step back and consider what drives the long-term success of cities and how this can be in conflict with the short-term priorities of politicians. Finally, I’ll suggest an alternative policy path for Boston informed by the above considerations.
Background
Like many cities, Boston is currently experiencing a crisis in its commercial1 property ecosystem. The rise of remote work in the wake of the pandemic has caused demand for urban office space to crater–over 20% of office space in Boston is now vacant. At the same time, the high debt burdens on many of these assets have come back to bite their owners as interest rates have risen, increasing debt servicing costs. Together, these two factors have hammered the cash flow and valuations of these buildings.
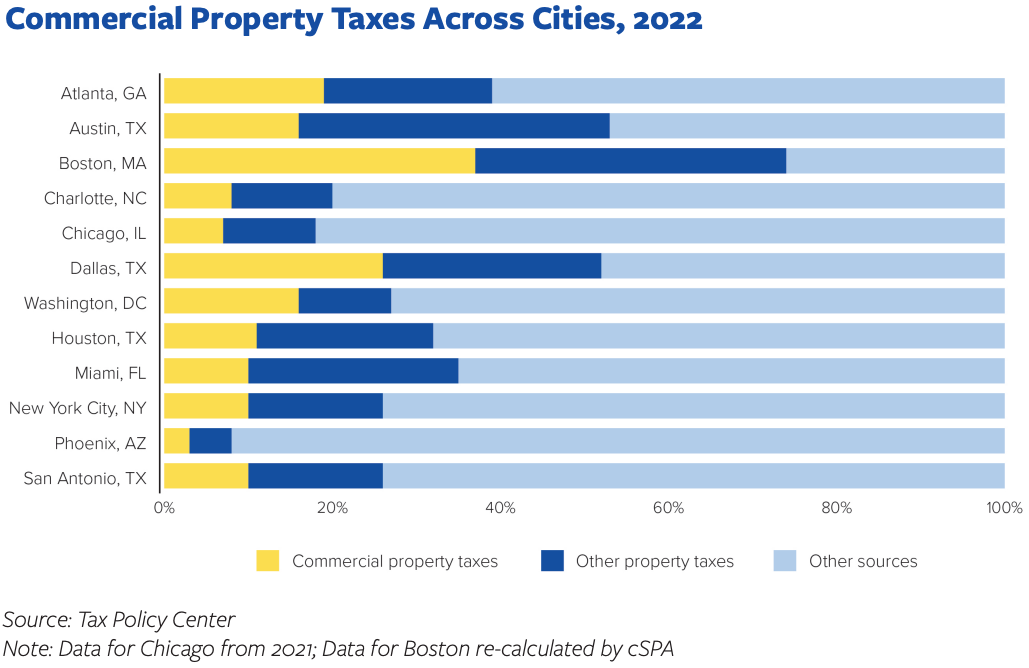
Boston differs from other cities in the degree to which it depends on property taxes broadly, and commercial property taxes in particular, for government revenue. Its Fiscal Year 2025 (FY25) budget expects 74% of its revenue to come from property taxes, with over 35% coming from commercial property. Most other large US cities derive less than half of their revenue from property taxes, with under 20% coming from commercial property.
There are a few factors behind Boston’s unusual tax composition. First, Boston charges a significantly higher millage rate2 on commercial property than on residential property–2.5% vs 1.1%. This skews Boston’s property taxes towards its commercial property and away from residential property. Second, Massachusetts broadly prohibits local sales and income taxes, meaning that the bulk of Boston’s non-property-tax revenue comes from smaller categories like excise taxes (on e.g. hotel stays and airplane fuel) and state aid.
This property-heavy tax base has pros and cons. On the plus side, property taxes are partially a tax on land, which is one of the most economically efficient ways for governments to raise revenue. Taxing improvements on land (i.e. buildings) cancels out much of this efficiency, though, especially where tax rates differ based on property type. Another advantage is property taxes’ relative insulation from short-term economic volatility. Commercial leases tend to last for several years, and commercial mortgages often last for over a decade. Many Boston properties are therefore still running on pre-pandemic rent rolls and interest payments, and city tax assessments reflect this fact, as evidenced by the continued upward climb of assessed commercial property values:
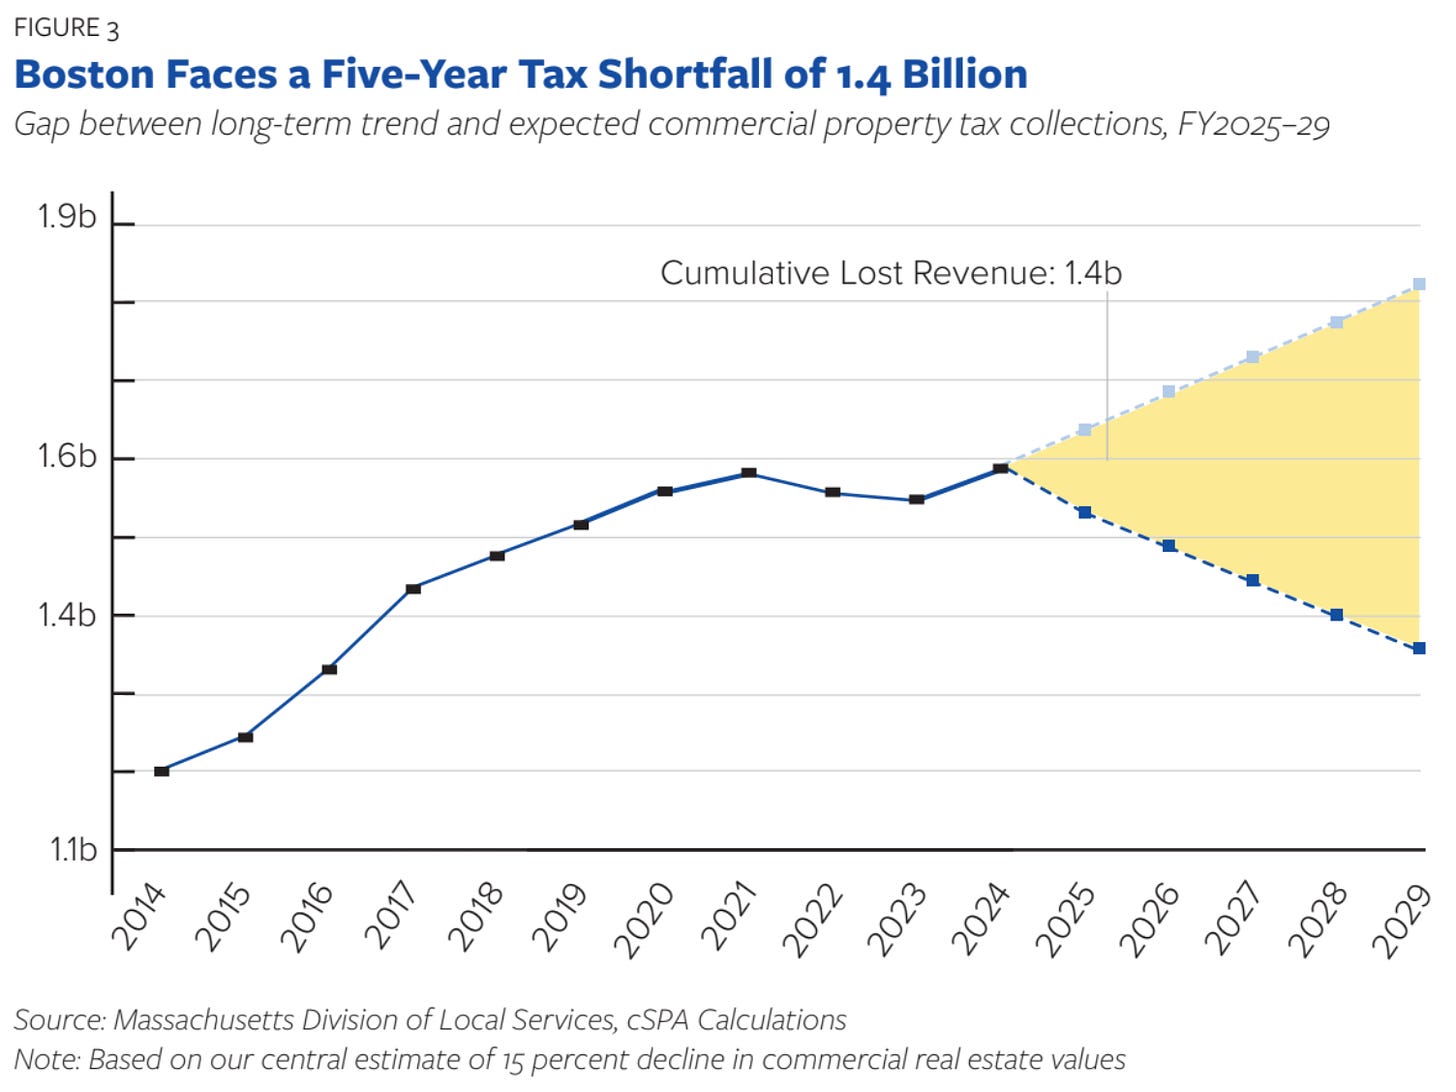
This means that Boston’s tax revenue growth has remained strong over the past few years despite the aforementioned collapse in the market (as opposed to assessed) value of commercial property. But properties are being revalued this year, meaning that commercial property taxes are expected to fall dramatically. This will be counterbalanced partially, but not fully by the continued rise of residential property values. The net projected impact is a cumulative budget deficit of $1.2-1.5B between 2025 and 2029–a major trend break for a city that has had an operating surplus every year since FY86.
This brings us to Mayor Wu’s tax proposal. In order to avoid the projected deficit, Wu wants to further increase the millage rate for commercial property taxes, from 175% of what a unified rate across commercial and residential property would be to 190% of that unified rate. Massachusetts law currently caps this rate at 175%, meaning that Boston would need the approval of the state legislature to implement this policy. The House passed a version of this policy at the end of the legislative session this summer, but the Senate, led by President Karen Spilka, refused, citing the expected damage the proposal would do to the city’s economy. Meanwhile, Wu continues to lobby the legislature to enable her commercial tax hike outside of the regular session, arguing that not doing so will require Boston to increase residential tax bills by 33%.
Fiscal Dynamics
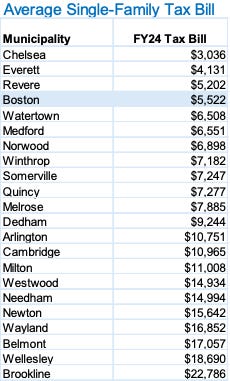
How should we evaluate these positions? First, it’s worth contextualizing the threat of a 33% increase in residential property taxes. Boston is currently exceedingly generous to its residential property taxpayers. Single-family tax bills are very low relative to other nearby cities and towns (see table below), in part because of the city’s residential exemption, which provides a tax break of up to $3,610.53 for owner-occupiers on top of the preferential millage rate. Given this, and given the fact that Boston home prices have increased by over 50% in the past five years, some residential tax increases are probably in order.
Second, commercial property valuations are highly sensitive to taxation. Increasing commercial tax rates decreases net income, which decreases property valuation. This, in turn, requires even higher tax rates to maintain revenue parity–a clearly unsustainable trajectory for both property owners and municipal budgets. Even though assessed values would not reflect this change until 2029, market values would react immediately, with potentially disastrous consequences for both property owners and their lenders.
Wu has argued that her proposal is justifiable because it resembles a similar authorization granted to Mayor Menino in the wake of the dotcom crash 20 years ago, which also caused Boston’s commercial property values to drop. However, there are a number of factors that should lead us to treat this claim with skepticism.
By 2004, though the impact of the dotcom crash had yet to fully recede, it was (correctly) seen as highly likely that the downtown office market would bounce back. Because of this, property owners were more willing to accept a temporary tax hit in the hopes that it would be made up for by a speedy recovery in property values. Today, almost no one expects that urban commercial property values will fully recover in the short term; remote and hybrid work appear to be here to stay, and unsustainable debt burdens will likely force distressed sales. Plus, property taxes only made up 54% of Boston’s budget in the early 00s–still high relative to other cities, but not as much of an all-eggs-in-one-basket approach as today’s 74%.
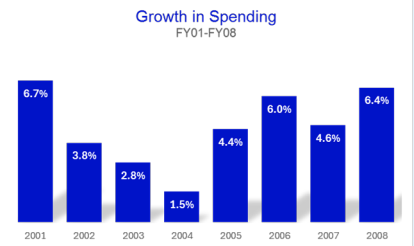
Another factor that contributed to the business community’s acceptance of Menino’s commercial property tax increase was the mayor’s fiscal discipline during that economic downturn. The city’s nominal spending increased by 3.8% in FY02, 2.8% in FY03, and only 1.5% in FY04–the last of these was actually a budget cut in inflation-adjusted terms. Full time headcount for city employees also decreased by 8.7% during this period. Property owners could therefore be persuaded that the tax increase was necessary to maintain the baseline functioning of city government and not merely a way to sustain profligate spending growth.
Contrast this with what Mayor Wu is asking for today. The proposed FY25 budget increases spending by 8% over FY24, after a decade that has seen spending increase by 54.8% and full time employee headcount increase by 7.6%. These increases exceed inflation by far, which has been 31.5% over the past decade and only 2.2% over the past year. And the city’s spending increase is especially notable given that its population has actually declined in recent years, from a local peak of nearly 695,000 on the eve of the pandemic to roughly 650,000 today. And the Massachusetts state budget increased by only 2.7% this year–a modest gain relative to inflation.3
So what’s behind Boston’s aggressive spending increase? The budget is staggeringly complex, with nearly 1000 top-level line items, each of which contains numerous relatively opaque subcomponents. For example, chosen roughly at random, FY25 has a $2.2M line item for “Contractual Services” under “Arts and Culture”. What are these services, who is providing them, and whom are they serving? The budget data do not answer these questions, and even digging into the departmental budget summary only clarifies that $143k of this goes to utilities, $8k to transportation, and $2.5k to communications, leaving $2M under the ambiguous “Contracted Services”. This makes it hard for an outside researcher or curious citizen to understand where all of the money is going on a granular level.
That said, even with the limited publicly available information at hand, some clear patterns emerge. The budget is dominated by spending on personnel services, which constitutes 62.4% of the total. Other large categories like pensions and debt service make up most of the rest; the city has relatively little control over these in the short run,4 so I won’t spend much time on them here.
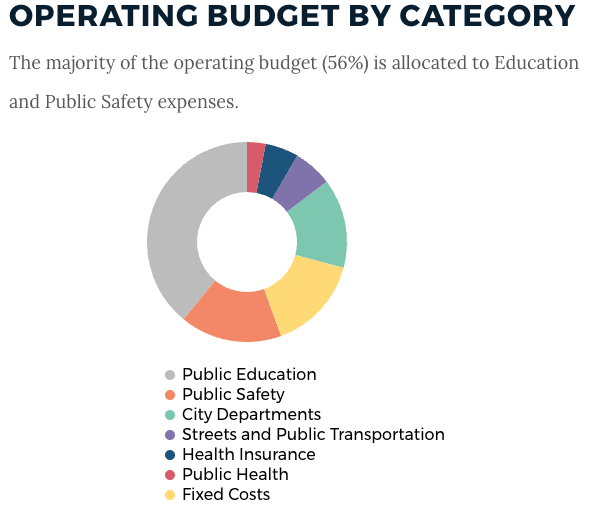
As for discretionary (i.e. non-mandatory) spending growth drivers, the bulk comes from three broad categories:
BPDA integration: This is a one-off stemming from the decision to integrate the formerly separate Boston Planning and Development Agency into City Hall. It’s actually a net positive for the city’s budget, as the $32M spending increase associated with it is more than offset by $42M of new revenue generated by the agency.
Police collective bargaining: Boston’s police union successfully negotiated for an $82M funding increase, one of the largest components of the city’s overall budget increase. While an argument can be made that most cities, including Boston, would do well to rein in their public sector unions, it’s also worth noting that Boston’s homicide rate is exceptionally low relative both to previous years and to other cities, in part due to the performance of the police department.
Education: Boston’s public school system (BPS) is by far the largest part of the city’s budget, clocking in at $1.53B for FY25. Annual cost per student stands at over $30,000–nearly double the national average, and especially grating given BPS’s abysmal performance. Only 27% of high school students tested at or above the proficient level in math, and only 34% in reading. Enrollment has declined by 15% over the past decade, yet the city continues to operate many schools well below capacity, burning resources unnecessarily given the opportunity for consolidation. Adding insult to injury, the Wu administration has undermined merit-based admissions at the city’s three exam schools in favor of policies intended to artificially favor specific racial groups, driving more families to private schools or out of the city entirely.
In addition to the three spending categories above, Boston continues to spend generously on programs that, while less financially impactful, highlight the current administration’s interest in allocating resources to favored groups in ways that show little regard for the city’s taxpayers and are often based on flawed or discriminatory reasoning.
Youth Employment and Opportunity ($4.3M increase, $22.6M total): The most recent impact report for this department is revealing–instead of providing any kind of quantitative evaluation of the skills gained by involved youth or of their productivity, it boasts of the number of jobs that the program itself created and workshops held, prompting a “give these workers spoons, not shovels” critique. Job programs, to the degree that they exist, should be about providing skills to place people in jobs demanded by the market, not creating synthetic jobs funded purely by the program itself.
Office of Workforce Development (missing data for previous years, $7.5M total): The latest annual report for this department discusses programs like free community college, paying high school students to take academic classes, free tax preparation, and free financial planning. All of these are subsidies to private individuals with little, if any, public benefit, and should be left to private charities rather than government.
Equity initiatives ($1.8M increase, $14.9M total): This category contains a variety of programs that explicitly favor groups on the basis of their race, gender, or sexual orientation–Black Male Advancement, Women’s Advancement, LGBTQ+ Advancement–running afoul of basic norms of non-discrimination. They could also expose the city, and by extension its taxpayers, to lawsuits challenging these practices.
Political Economy
Critiquing these policies at a granular level can be valuable, but it’s also worth taking a step back to consider the broader picture of how cities work, how governments can help or hinder their functioning, and how political incentives can lead to myopic policies.
Urbanist Alain Bertaud5 notes that cities are, at their core, labor markets. Cities’ primary advantage lies in enabling large numbers of people to work together and exchange ideas in ways that result in productivity-enhancing inventions and innovations. Cities also must generally export this knowledge output in exchange for raw materials produced elsewhere, as they typically cannot produce enough of these basic inputs to support their large, dense populations. The high-productivity industries built around this knowledge are what enable cities to function; most other urban amenities, including government services, depend on the wealth they generate.
It is therefore essential for city governments to prioritize the services that enable their wealth-generating industries and people to flourish. Law enforcement is necessary to protect residents and property from violence and theft; construction and maintenance of transportation and utility infrastructure is necessary to enable efficient movement and cleanliness; fire departments are necessary to protect public and private infrastructure from destruction; public education can help to prepare workers for participation in the economy. Taxation, to the degree that it feeds this engine, is a standard part of a well-functioning urban ecosystem.
Unfortunately, politicians are easily tempted to behave in ways that run counter to these goals. Spending on short-term giveaways is often a more expedient path to re-election than investing in the long-term economic health of the city. A major infrastructure initiative with significant expected long-term payoff typically provides little short-run benefit and significant disruption, while simply handing money out to voters buys loyalty now, even if it provides little lasting benefit to the city.
And there’s an additional element of this regarding the relative cost of buying votes from different groups; a $500 payout, whether in the form of spending or tax breaks, is much more salient for a low-income voter than a high-income one, meaning that politicians who wish to buy votes cheaply will often target voters in lower socioeconomic tiers. Similarly, public-sector unions can be courted with policies like protection from termination for low-performing employees that, while “cheap” in financial terms, can have dire consequences for the functioning of the systems (education, public safety) to which they are applied.
Taken to extremes, this can even reshape a city’s electorate. James Michael Curley, who served four non-contiguous terms as mayor of Boston between 1914 and 1950, heaped largesse on his poorer Irish constituents while heavily taxing (and haranguing) the city’s wealthier English. As a result, the bulk of Boston’s English population departed for the suburbs, leaving behind an electorate that was much more favorably disposed to Curley and his policies and ushering in a period of economic stagnation in Boston. This pattern of “increasing the relative size of one’s political base through distortionary, wealth-reducing policies”, labeled “the Curley Effect” by economists Ed Glaeser and Andrei Shleifer, has played out in numerous other polities, and is well-known to students of urban economics like Mayor Wu.
Paths Forward
Wu’s political coalition may, in a practical sense, have locked her in to supporting politically expedient but wealth-destroying policies like her proposed commercial property tax hike, but it’s still worth thinking about how a different mayor could approach the problem of solving Boston’s impending fiscal imbalance.
As pointed out by the Tufts Center for State Policy Analysis and the Boston Policy Institute, the magnitude of Boston’s impending tax shortfall is too great to be papered over by creative accounting. The city will need some combination of spending cuts and increased revenue to maintain a balanced budget.
On the spending side, it’s clear that Boston has many programs (some of which are mentioned above) that do not meaningfully contribute to the long-term prosperity and safety of the city. Many of these should be eliminated altogether. Additionally, while a functioning public school system is necessary for the city to thrive and to attract and retain families with high educational standards, it is clear that Boston is getting poor results for the amount of money it spends on its schools. Major reform–some combination of school closures/consolidation, merit pay, and a greater role for school choice and vocational education–is necessary.
As for revenue, there are a number of creative solutions that would not only provide funding, but also create positive incentives and externalities for the city. A congestion tax, while likely to be contentious, would provide some revenue while encouraging more efficient use of the city (and region)’s roads and public transportation. Boston also has numerous city-owned parcels on which it could expedite privatization and development. Not only would this generate short-term windfalls for the city, it would also convert these parcels from cost centers to ongoing sources of property tax revenue while simultaneously helping to address the city’s housing shortage. Many cities have their own sales taxes, which provide considerable revenue with minimal behavior distortion relative to taxes on e.g. income. And lastly, and perhaps most significantly, Boston could allow its relatively low residential property taxes to approach the level of other municipalities in Greater Boston, perhaps by reducing the residential exemption.
The policies proposed in this section are well-suited to the twin challenges of eliminating Boston’s near-term budget deficit and bolstering the city’s long-term competitiveness. While the current administration may not be receptive to suggestions along these lines, Massachusetts is fortunate to have both a legislature that can protect Boston from myopic governance and a number of current and aspiring politicians who might be able to implement them following next year’s mayoral election.
Here, “commercial property” excludes large residential properties, which are often referred to as “commercial real estate” in other contexts, in order to reflect the City of Boston’s property tax classifications. It therefore refers primarily to office, retail, industrial, and lab properties.
I.e. amount of tax owed per dollar of property value.
Generally, most of these obligations were incurred by previous administrations, so they can’t be blamed on the current administration. This is arguably a problem with cross-generational government transfers in democracies broadly, which could be effectively addressed by privatization of entitlements and/or insulating more of governance from democratic constraints, but that’s beyond the scope of this essay.
His book Order Without Design is recommended reading for anyone interested in cities.



Sorry for missing this when it came out - its great to see BPI's work helping inform the thinking of folks on the ground!